R has become a reliable tool in the data processing and analysis space. A must-have package for manipulating data in R is dplyr, which contains the flexible pivot_longer() function. This feature changes the game when it comes to repurposing your data, making it an indispensable resource for academics, analysts, and data scientists alike. In this article, we will learn about pivot_longer function, it’s syntax, examples, and difference with pivot_wider().
What is pivot_longer()?
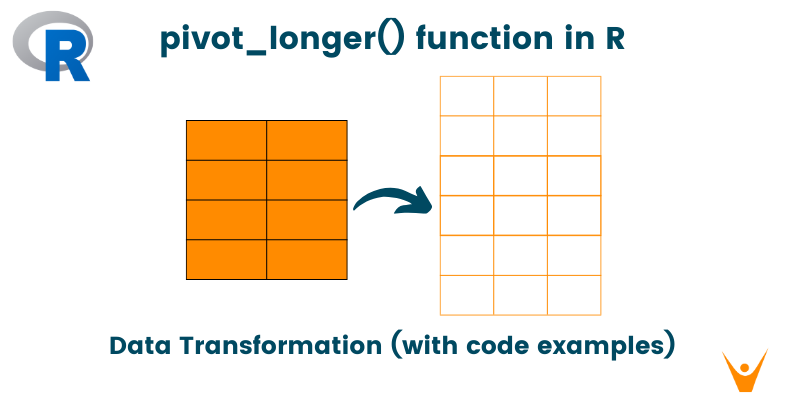
The pivot_longer() function is a component of the tidyverse ecosystem, residing within the tidyr package. It provides a sophisticated way to transform large datasets into lengthy formats. In essence, it helps to convert a large-scale dataset into a lengthier, easier-to-manage format.
How to Use pivot_longer() in R?
Let’s first understand the basic syntax of pivot_longer() in R before starting with the examples and use.
pivot_longer(data, cols, names_to = NULL, values_to = "value")
Here,
- data: The input data frames
- cols: Columns to reshape.
- names_to: The name of the new column that will store the variable names.
- values_to: The name of the new column that will store the values.
Example:
Consider a dataset with multiple columns representing different time points, and you want to reshape it into a longer format. Here's how you can use pivot_longer():
Code:
library(tidyr)

data <- data.frame(ID = c(1, 2, 3),
                   Day1 = c(25, 30, 20),
                   Day2 = c(22, 28, 18),
                   Day3 = c(20, 25, 15))

long_data <- pivot_longer(data, cols = starts_with("Day"),
                          names_to = "Day", values_to = "Value")

print(long_data)
Output:
# A tibble: 9 × 3
     ID Day   Value

1     1 Day1     25
2     1 Day2     22
3     1 Day3     20
4     2 Day1     30
5     2 Day2     28
6     2 Day3     25
7     3 Day1     20
8     3 Day2     18
9     3 Day3     15
The pivot_longer() is applied to columns starting with "Day," resulting in a dataset where the "Day" column contains the day information, and the "Value" column contains the corresponding values.
More Examples on Pivot_longer()
Suppose you have a dataset containing information about different products, their sales, and their corresponding prices in a wide format.
wide_data <- data.frame(Product = c("A", "B", "C"),
                        Sales_2021 = c(100, 150, 120),
                        Sales_2022 = c(120, 160, 130),
                        Price_2021 = c(10, 15, 12),
                        Price_2022 = c(12, 16, 13))
Using pivot_longer(), you can reshape this data into a more manageable format.
Code:
long_data_product <- pivot_longer(wide_data,
                                  cols = starts_with("Sales") | starts_with("Price"),
                                  names_to = c(".value", "Year"),
                                  names_pattern = "([A-Za-z]+)_(\\d+)")

print(long_data_product)
Output:
# A tibble: 6 × 4
  Product Year  Sales Price

1 A       2021    100    10
2 A       2022    120    12
3 B       2021    150    15
4 B       2022    160    16
5 C       2021    120    12
6 C       2022    130    13
Here, the pivot_longer() is used to transform the wide dataset into a longer format, creating columns for "Sales" and "Price," with an additional column for the corresponding year.
What Does pivot_longer Function Do in R?
The main goal of pivot_longer() is to reshape data from a wide to a long format. It accomplishes this by gathering columns into key-value pairs, with one column containing the variable names and another holding the corresponding values. This transformation proves especially valuable in situations where the wide format of the data poses challenges for specific analyses or visualizations.
Difference Between pivot_wider and pivot_longer
While pivot_longer() is utilized to convert data from wide to long format, pivot_wider() performs the opposite operation by reshaping data from long to wide format. Essentially, pivot_longer() is applied when variables are distributed across multiple columns and need to be stacked into a single column. On the other hand, pivot_wider() is employed when dealing with a key-value pair structure, and the goal is to spread the values across multiple columns.
This example will help us illustrate the difference:
Code:
long_data <- data.frame(ID = c(1, 2, 3),
                        Variable = c("A", "B", "C"),
                        Value = c(10, 15, 12))

wide_data <- pivot_wider(long_data, names_from = Variable, values_from = Value)

print(wide_data)
Output:
# A tibble: 3 × 4
     ID     A     B     C

1     1    10    NA    NA
2     2    NA    15    NA
3     3    NA    NA    12
In this example, pivot_wider() is applied to the long-format data, creating columns for each unique value in the "Variable" column.
Difference Between melt and pivot_longer
The melt() function in R, often used with the reshape2 package shares the same goal with pivot_longer() function, that of transforming the data. But both differ in terms of syntax and implementation.
melt() Code:
library(reshape2)

melted_data <- melt(wide_data, id.vars = "ID", variable.name = "Variable", value.name = "Value")

print(melted_data)
Output:
  ID Variable Value
1  1        A    10
2  2        A    NA
3  3        A    NA
4  1        B    NA
5  2        B    15
6  3        B    NA
7  1        C    NA
8  2        C    NA
9  3        C    12
In this example, melt() is used to transform the wide-format data into long format. The id.vars parameter specifies the identifier variable, and the variable.name and value.name parameters define the names of the new columns for variable names and values, respectively.
pivot_longer() Code:
library(tidyr)

long_data <- pivot_longer(wide_data, cols = -ID, names_to = "Variable", values_to = "Value")

print(long_data)
Output:
# A tibble: 9 × 3
     ID Variable Value

1     1 A           10
2     1 B           NA
3     1 C           NA
4     2 A           NA
5     2 B           15
6     2 C           NA
7     3 A           NA
8     3 B           NA
9     3 C           12
In contrast, pivot_longer() offers a more concise syntax to achieve the same outcome. Operating within the tidyverse framework, it seamlessly integrates with other tidyverse functions.
Conclusion
In the world of working with data in R, pivot_longer() is a handy tool for changing how data looks. It's great for turning wide data into a format that's easier to handle. This opens up new ways to analyze, visualize, and model your data. If you understand how to use pivot_longer() well, it's a useful skill that can make you better at working with data in R. To sum it up, whether you're dealing with time-series data, product info, or any situation where data is spread across many columns, pivot_longer() is the function you want. It helps make your data neat and ready for analysis. As you get more into using R's tidyverse, pivot_longer() will become an essential tool in your data toolbox.


