Data manipulation is central to statistical analysis and machine learning tasks. Combining or reshaping datasets is a common requirement when working with datasets, regardless of whether they are large or small. The R programming language functions--rbind() and cbind() are required for binding rows and columns, respectively. In this article, we'll go over every aspect of rbind in R, including its applications, variations, and how to use it effectively alongside cbind.
What is rbind in R?
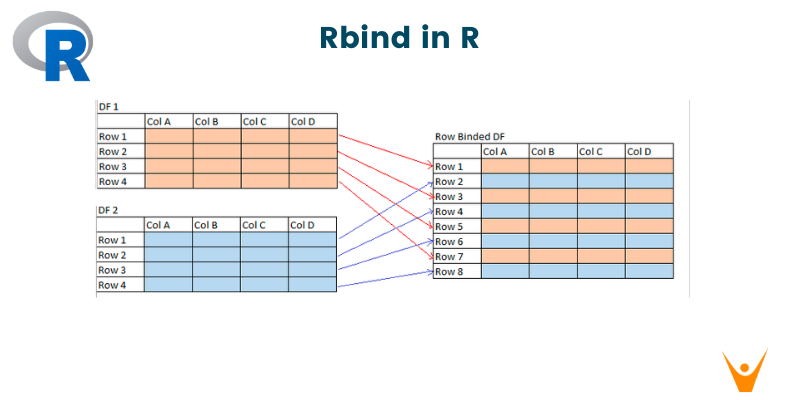
Rbind function combines data frames or matrices by row. The name "rbind" means "row bind," which reflects its main purpose. When you have multiple datasets with the same columns and want to stack them vertically, use rbind.
Here's a simple example to illustrate its basic usage.
Code:
df1 <- data.frame(ID = c(1, 2, 3), Name = c("Andrew", "Billy", "Charles"))
df2 <- data.frame(ID = c(4, 5, 6), Name = c("Daniel", "Eva", "Freddy"))

combined_df <- rbind(df1, df2)

print(combined_df)
Output:
  ID    Name
1  1  Andrew
2  2   Billy
3  3 Charles
4  4  Daniel
5  5     Eva
6  6  Freddy
In this example, df1 and df2 are data frames with the same structures. The rbind function is then used to combine the rows, resulting in a new data frame combined_df.
Dealing with Unequal Columns
A key characteristic of rbind is its ability to handle datasets with unequal columns. When binding two data frames with different columns, rbind replaces missing columns with NAs. This flexibility allows you easily to combine datasets that may not have the same structure with ease.
We need to use the rbind.fill() function present in the plyr library to fill the empty value with NA.
Code:
library(plyr)

df1 <- data.frame(x = 1:3, y = letters[1:3])
df2 <- data.frame(x = 4:5, z = letters[4:5])

combined_df <- rbind.fill(df1, df2)

print(combined_df)
Output:
  x    y    z
1 1    a
2 2    b
3 3    c
4 4     d
5 5     e
In this case, NA is used to replace the missing values from the dataframes.
Advanced Usage with Lists
In addition to simple data frames, rbind can also be used with lists of data frames. This is very useful when dealing with large amounts of data. The do.call function allows us to pass a list of data frames to rbind so that it can effectively combine them.
Code:
df_list <- list(data.frame(ID = c(13, 14, 15), Name = c("Jack", "Kelly", "Liam")),
                data.frame(ID = c(16, 17, 18), Name = c("Mia", "Nathan", "Olivia")))

combined_df_list <- do.call(rbind, df_list)

print(combined_df_list)
Output:
  ID   Name
1 13   Jack
2 14  Kelly
3 15   Liam
4 16    Mia
5 17 Nathan
6 18 Olivia
Here, df_list is a list containing two data frames. The do.call(rbind, df_list) function call applies the rbind to the list, resulting in the combined data frame combined_df_list.
Enhancing Flexibility with cbind
Rbind is designed for vertical stacking of datasets, the cbind function is used to bind columns. The name "cbind" stands for "column bind," focusing on the tool's ability to merge datasets horizontally by appending columns.
You can learn more about cbind here.
Handling Row Mismatch in cbind
Cbind, like rbind, can handle datasets with varying numbers of rows. When binding columns with uneven row counts, cbind adds NAs to the shorter dataset to make it the same length as the longer one.
Code:
vec1 <- 1:4
vec2 <- letters[1:3]

combined_df <- cbind(vec1, vec2)

print(combined_df)
Output:
     vec1 vec2
[1,]    1    a
[2,]    2    b
[3,]    3    c
[4,]    4
Combining cbind and rbind for Full Flexibility
The true power of data binding in R is seen when rbind and cbind are used together, wisely. Depending on our data manipulation requirements, we can stack datasets vertically or horizontally to create elaborate and customized structures.
Code:
df1 <- data.frame(id = 1:3, name = c("Andrew", "Billy", "Charles"), age = c(25, 30, 28))

df2 <- data.frame(id = 4:6, name = c("Daniel", "Eva", "Freddy"), occupation = c("Engineer", "Doctor", "Teacher"))

extra_info <- c("New York", "London", "Paris")

combined_df <- rbind.fill(df1, df2)

print(combined_df)

combined_df <- cbind(combined_df, city = extra_info)

print(combined_df)
Output:
  id    name age occupation
1  1  Andrew  25
2  2   Billy  30
3  3 Charles  28
4  4  Daniel  NA   Engineer
5  5     Eva  NA     Doctor
6  6  Freddy  NA    Teacher

  id    name age occupation     city
1  1  Andrew  25        New York
2  2   Billy  30          London
3  3 Charles  28           Paris
4  4  Daniel  NA   Engineer New York
5  5     Eva  NA     Doctor   London
6  6  Freddy  NA    Teacher    Paris
Now to combine these two functions in a single dataframe.
Code:
df5 <- data.frame(ID = c(19, 20, 21), Score = c(85, 92, 78))
df6 <- data.frame(Subject = c("Math", "English", "Science"), Grade = c("A", "B", "C"))
df9 <- data.frame(ID = c(25, 26, 27), Score = c(88, 94, 79))
df10 <- data.frame(Subject = c("History", "Geography", "Art"), Grade = c("B", "A", "C"))

combined_df_full <- cbind(rbind(df5, df9), cbind(df6, df10))
combined_df_full
Output:
  ID Score Subject Grade   Subject Grade
1 19    85    Math     A   History     B
2 20    92 English     B Geography     A
3 21    78 Science     C       Art     C
4 25    88    Math     A   History     B
5 26    94 English     B Geography     A
6 27    79 Science     C       Art     C
Here, df9 and df10 are combined first using rbind vertically. Then, the result is combined with the previously created combined_df_columns horizontally using cbind. The final data frame combined_df_full showcases the seamless integration of both functions.
Conclusion
Mastering the rbind function in R reveals a powerful tool for the seamless concatenation of data frames by rows, allowing for greater flexibility when dealing with datasets of varying structures. When combined with cbind, these functions can be together used for any kind of comprehensive data manipulation, including vertical and horizontal concatenation. Whether combining two data frames or iterating through a list, rbind's efficiency is visible. The ability to manipulate and merge datasets is an essential skill. Mastering this will help you in the longer run.


